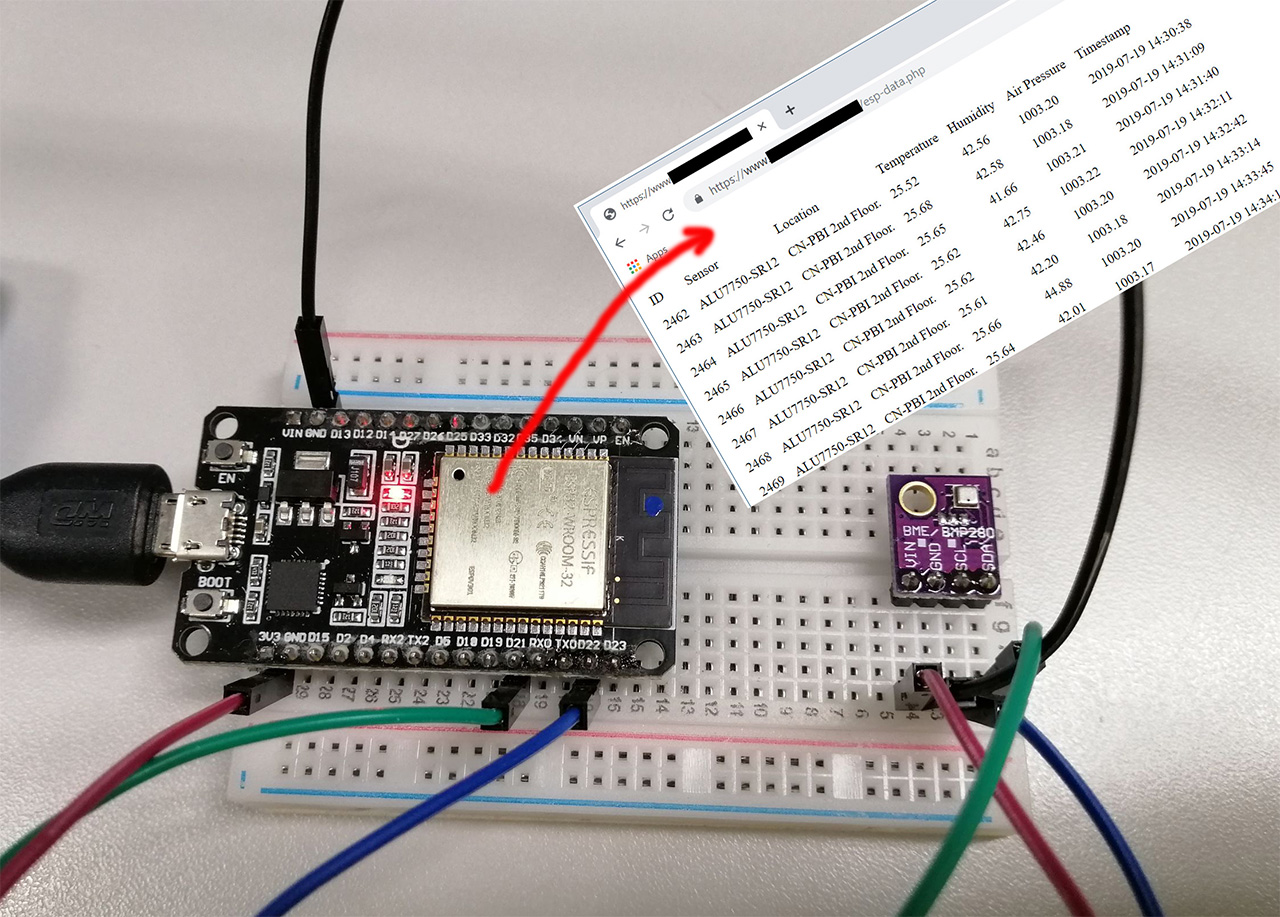
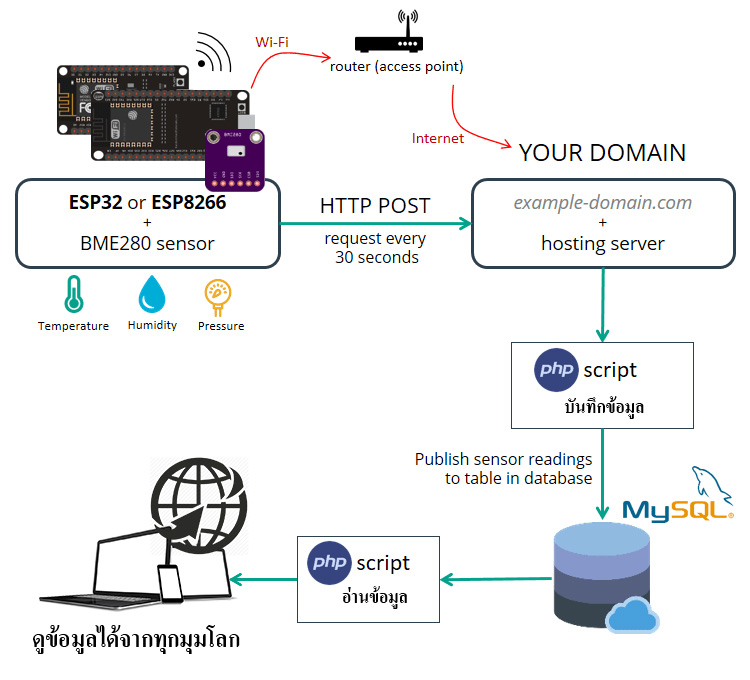
บทความนี้จะสอนการส่งข้อมูลจาก ESP32 ไปเก็บในฐานข้อมูล MySQLโดยผมจะใช้ BME280 sensor วัดอุณหภูมิความชื้น เชื่อมต่อกับ ESP32 เชื่อมต่อ wifi ออก internet ทำให้เราสามารถดูข้อมูลจากที่ไหนก็ได้ที่มี internet และยังนำข้อมูลย้อนหลังไปวิเคราะห์ได้ด้วย

สิ่งที่ต้องเตรียมเพื่อทำ Project นี้
    • ESP32 or ESP8266 และโปรแกรม Arduino IDE
    • Hosting server and domain name
    • PHP script to insert data into MySQL and display it on a web page
    • MySQL database to store readings
1. สิ่งแรกคือเราต้องมี Hosting และ Domain Name เพื่อรัน PHP Application and MySQL Database

เป้าหมายของโปรเจ็คนี้คือเราต้องดูข้อมูลด้วยการเข้าถึงโดเมนเซิร์ฟเวอร์ของเราเอง ไม่ว่าจะอยู่ส่วนไหนของโลก ผมจะไม่กล่าวถึงการสร้างเว็บไซต์นะครับ ลองหาข้อมูลดูครับไม่ยาก

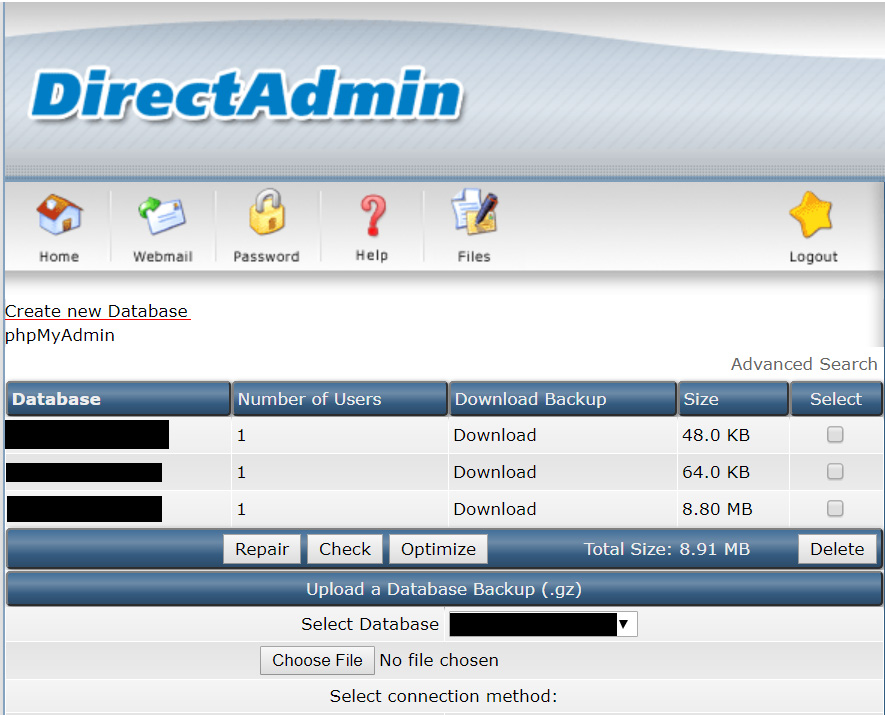
2. เตรียมฐานข้อมูล MySQL

ขั้นตอนแรก ต้องสร้าง Database และ User

Create new database

จากนั้นกำหนดชื่อ Database ,User ,Password

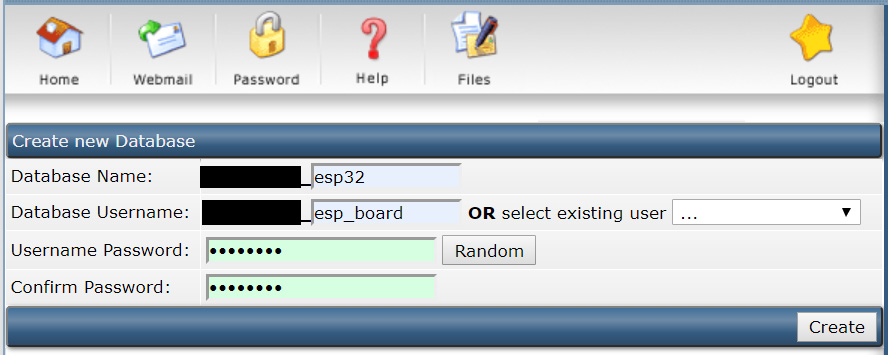
จบขั้นตอนการสร้างฐานข้อมูลและผู้ใช้ใหม่ ตอนนี้ให้บันทึกรายละเอียดทั้งหมด เพราะต้องใช้ในขั้นตอนถัดๆไป:

    • ชื่อฐานข้อมูล: example_esp_data
    • ชื่อผู้ใช้: example_esp32
    • รหัสผ่าน: รหัสผ่านของคุณ
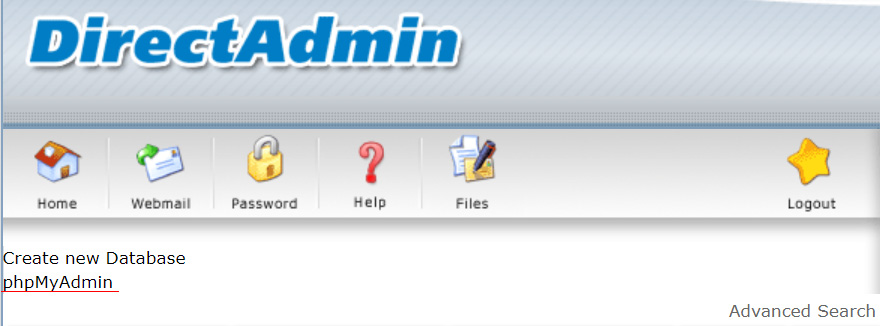
ต่อไปเราจะสร้าง Table SQL ไปที่หน้า Directadmin หาคำว่า phpMyAdmin

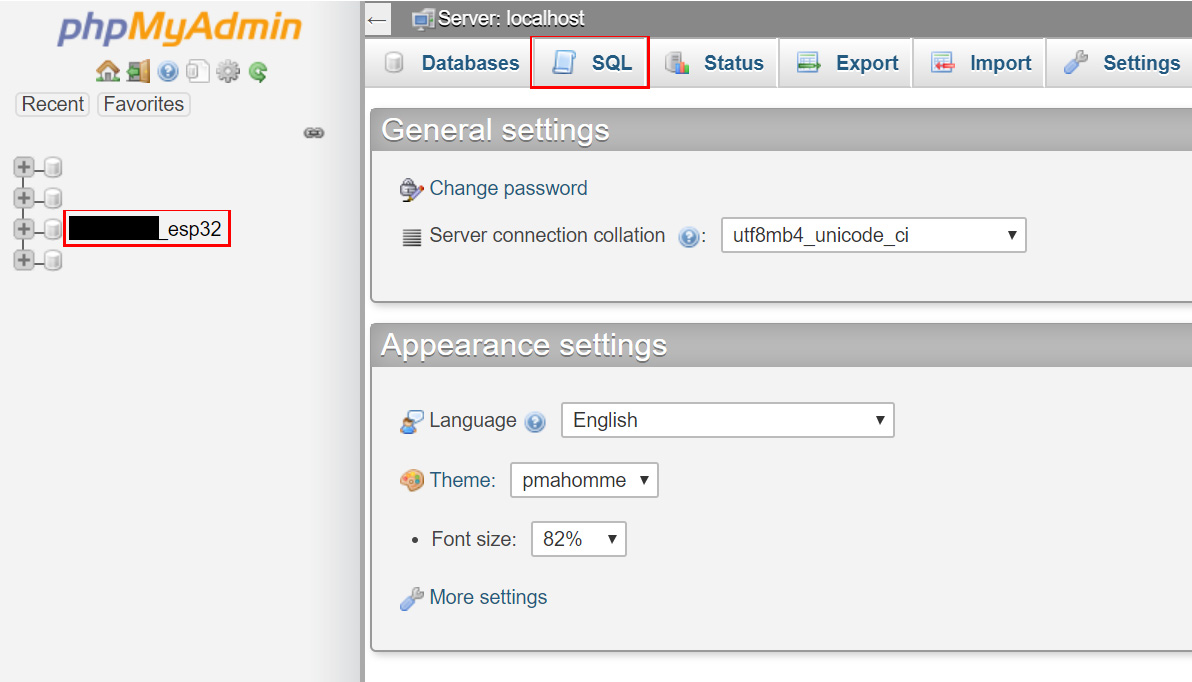
ในแถบด้านข้างซ้ายเลือกชื่อฐานข้อมูลของคุณ example_esp32 และเปิดแท็บ“ SQL”

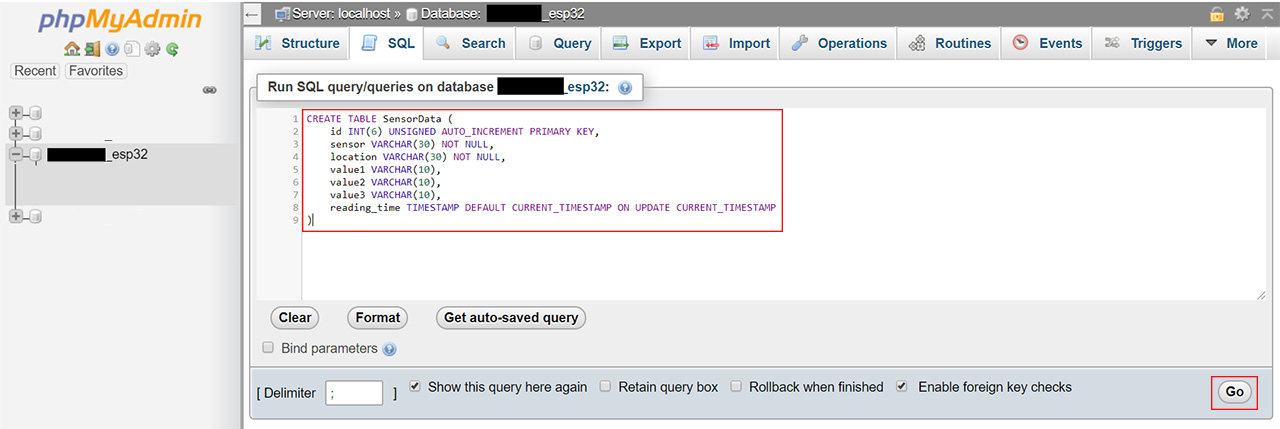
คัดลอก SQL query ด้านล่างไปวางในกรอบสีแดง แล้วกด “Go":
CREATE TABLE SensorData (
id INT(6) UNSIGNED AUTO_INCREMENT PRIMARY KEY,
sensor VARCHAR(30) NOT NULL,
location VARCHAR(30) NOT NULL,
value1 VARCHAR(10),
value2 VARCHAR(10),
value3 VARCHAR(10),
reading_time TIMESTAMP DEFAULT CURRENT_TIMESTAMP ON UPDATE CURRENT_TIMESTAMP
)
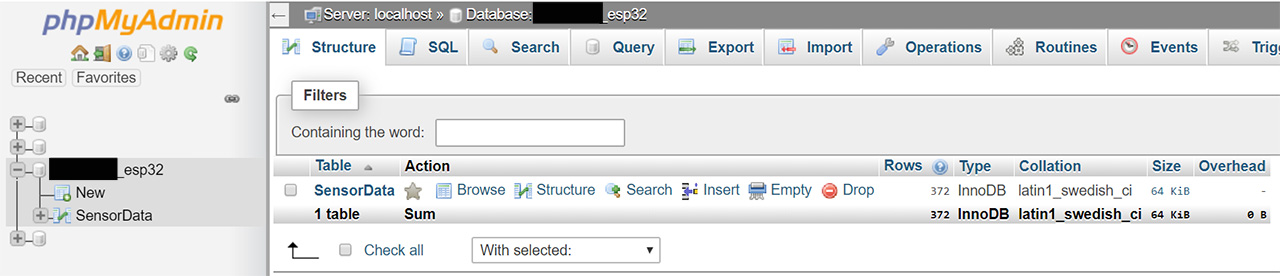
หลังจากนั้นต้องเห็นตารางที่สร้างขึ้นใหม่ชื่อ SensorData ในฐานข้อมูล example_esp32 ดังแสดงในรูปด้านล่าง:
3. จากนี้จะเป็นการเขียน PHP Script HTTP POST – แทรกข้อมูลในฐานข้อมูล MySQL

ในส่วนนี้เราจะสร้างสคริปต์ PHP ที่มีหน้าที่ในการรับคำขอขาเข้าจาก ESP32 และแทรกข้อมูลลงในฐานข้อมูล MySQL

ถ้าใช้ hosting ที่มี Control Panel, ให้หาคำว่า “File Manager”:
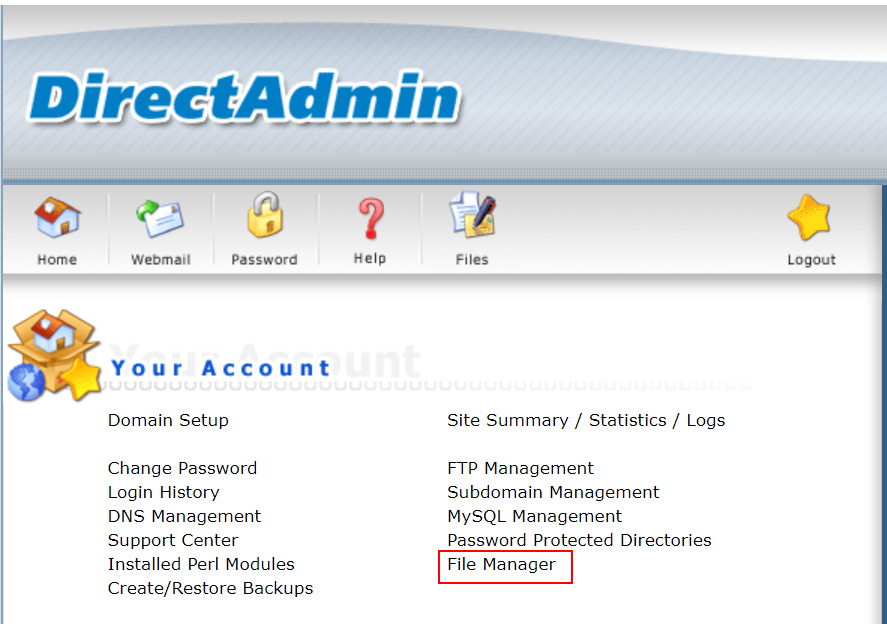
เลือก public_html
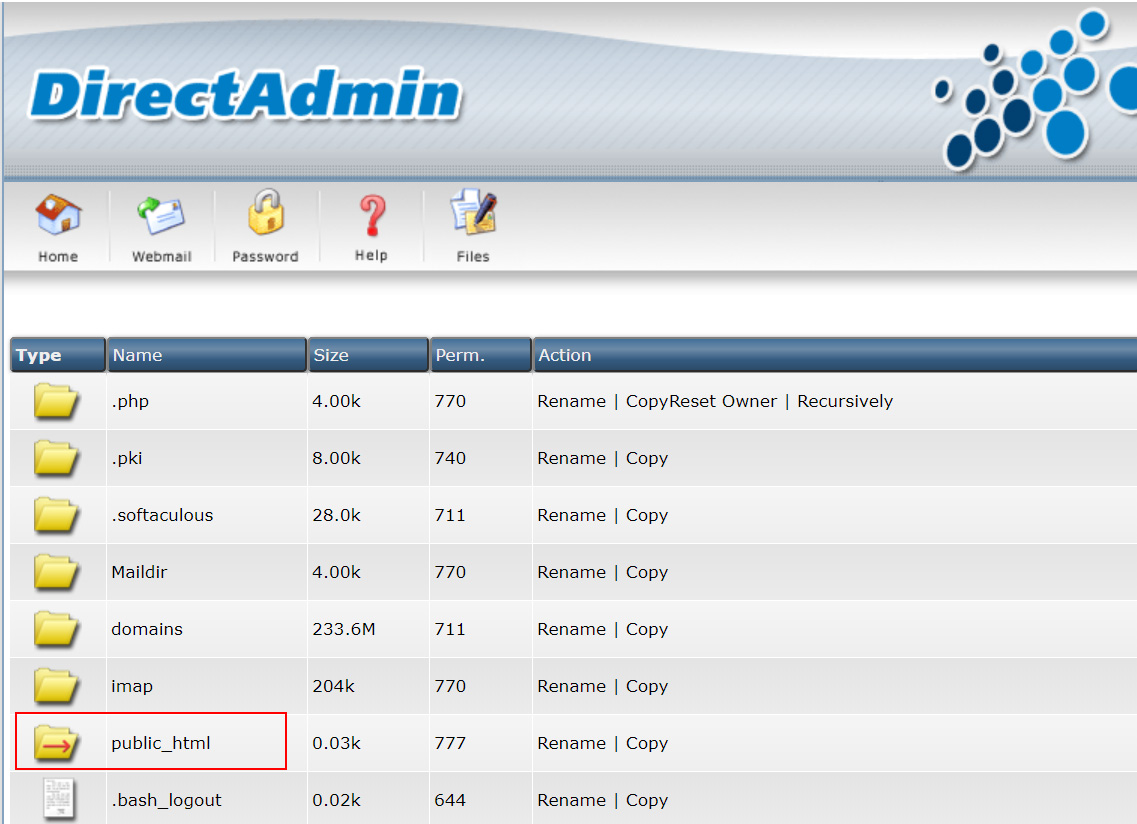
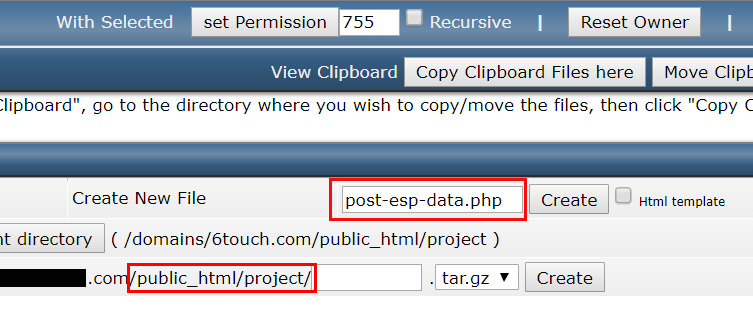
สร้างไฟล์ใหม่ภายใต้ /public_html ชื่อตามนี้: post-esp-data.php
โค๊ตไฟล์ post-esp-data.php ตามด้านล่าง
$servername = “localhost";
// REPLACE with your Database name
$dbname = “REPLACE_WITH_YOUR_DATABASE_NAME";
// REPLACE with Database user
$username = “REPLACE_WITH_YOUR_USERNAME";
// REPLACE with Database user password
$password = “REPLACE_WITH_YOUR_PASSWORD";
// Keep this API Key value to be compatible with the ESP32 code provided in the project page. 
// If you change this value, the ESP32 sketch needs to match
$api_key_value = “tPmAT5Ab3j7F9";
$api_key$sensor = $location = $value1 = $value2 = $value3 = “";
if ($_SERVER[“REQUEST_METHOD"] == “POST") {
    $api_key = test_input($_POST[“api_key"]);
    if($api_key == $api_key_value) {
        $sensor = test_input($_POST[“sensor"]);
        $location = test_input($_POST[“location"]);
        $value1 = test_input($_POST[“value1"]);
        $value2 = test_input($_POST[“value2"]);
        $value3 = test_input($_POST[“value3"]);
        // Create connection
        $conn = new mysqli($servername$username$password$dbname);
        // Check connection
        if ($conn->connect_error) {
            die(“Connection failed: “ . $conn->connect_error);
        }
        $sql = INSERT INTO SensorData (sensor, location, value1, value2, value3)
        VALUES (‘" . $sensor . “‘, ‘" . $location . “‘, ‘" . $value1 . “‘, ‘" . $value2 . “‘, ‘" . $value3 . “‘);
        if ($conn->query($sql) === TRUE) {
            echo “New record created successfully";
        }
        else {
            echo “Error: “ . $sql . 
 . $conn->error;
        }
        $conn->close();
    }
    else {
        echo “Wrong API Key provided.";
    }
}
else {
    echo “No data posted with HTTP POST.";
}
function test_input($data) {
    $data = trim($data);
    $data = stripslashes($data);
    $data = htmlspecialchars($data);
    return $data;
}
ก่อน save ไฟล์ ต้องแก้ $dbname$username and $password ที่เรากำหนดไว้:
// Your Database name
$dbname = "example_esp32";
// Your Database user
$username = "example_esp_board";
// Your Database user password
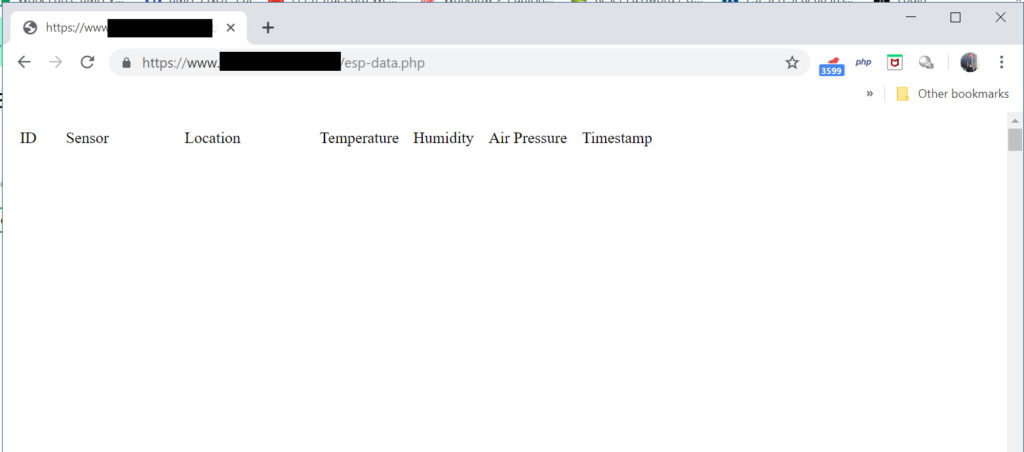
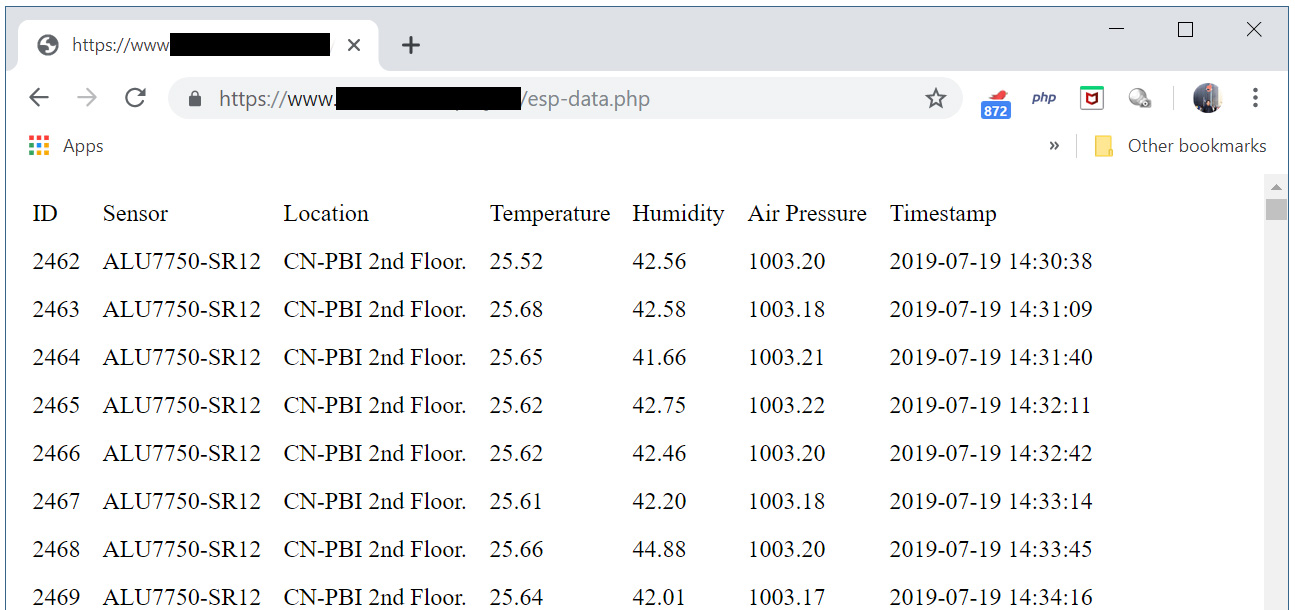
$password = "YOUR_USER_PASSWORD";
ลองทดสอบด้วยการเข้าลิงค์

http://example-domain.com/esp-data.php

5. ต่อไปนี้มาที่ ESP32
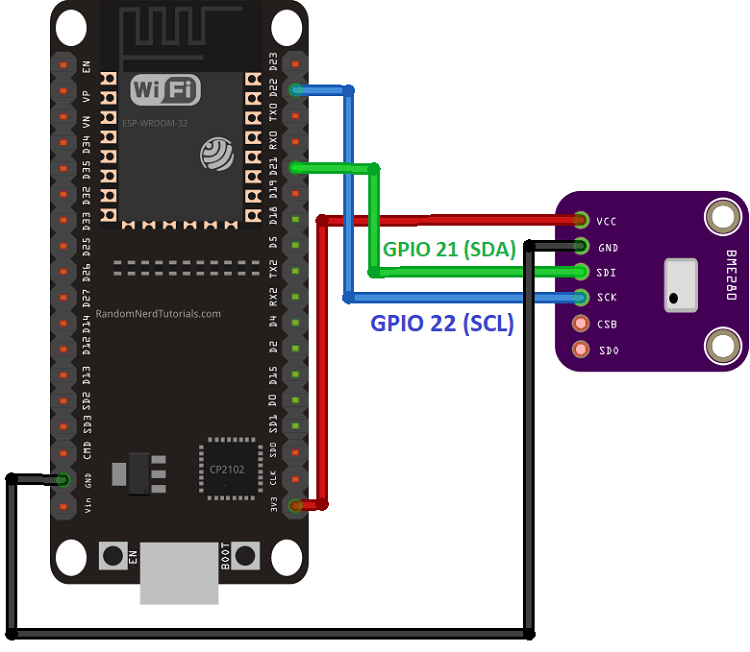
ให้ประกอบวงจรกับ BME280 เพื่อจะส่งค่าอุณหภูมิ ,ความชื้น ,และความดันอากาศทุกๆ 30 วินาที
BME280 wiring to ESP32

The ESP32 I2C pins are:

      • GPIO 22: SCL (SCK)
      • GPIO 21: SDA (SDI)
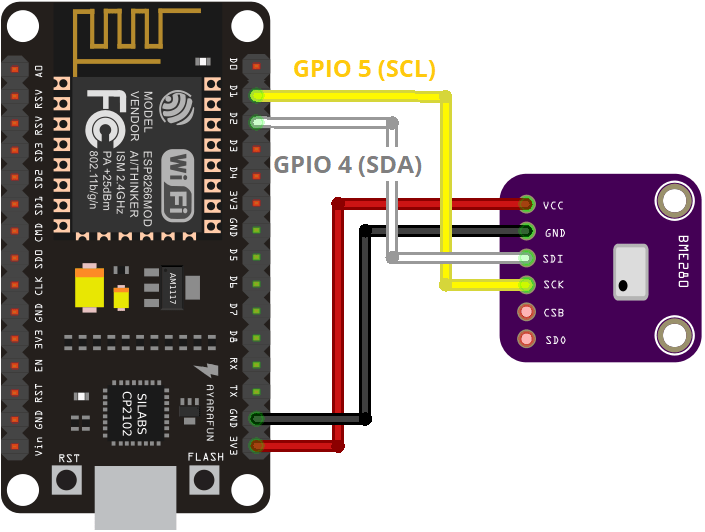
BME280 wiring to ESP8266

The ESP8266 I2C pins are:

      • GPIO 5 (D1): SCL (SCK)
      • GPIO 4 (D2): SDA (SDI)
ESP32/ESP8266 Code

ก่อนเราจะโปรแกรมลงบอร์ด ESP32/ESP8266 เราต้องมีโปรแกรม Arduino IDE, ให้ไป download และ Install ตามรายละเอียด:

หลังจากนั้นให้คัดลอก code ทั้งหมดและแก้ไขให้ทำงานได้ถูกต้องแล้ว upload ลง ESP32 Board

#ifdef ESP32
//  #include 
  #include 
  #include 
#else
  #include 
  #include 
  #include 
#endif
#include 
#include 
#include 
// Replace with your network credentials
const char *userid = “004714";            //IoTtweet account user ID (6 digits, included zero pre-fix)
const char *key = “4zgpz0eyqqer";               //IoTtweet registered device key in “MY IOT Garage"
const char* ssid     = “smartmonitor";
const char* password = “01004714";
// REPLACE with your Domain name and URL path or IP address with path
const char* serverName = “https://www.6touch.com/project/post-esp-data.php";
// Keep this API Key value to be compatible with the PHP code provided in the project page. 
// If you change the apiKeyValue value, the PHP file /post-esp-data.php also needs to have the same key 
String apiKeyValue = “tPmAT5Ab3j6te";
String sensorName = “ALU7750-SR12 “;
String sensorLocation = “CN-PBI 2nd Floor.";
float data0, data1, data2, data3;                        //Your sending data variable.
String private_tweet = “Good Luck";                  //Your private tweet meassage to dashboard
String public_tweet = “Welcome to CN-PBI";        //Your public tweet message to dashboard
IoTtweetESP32 myiot;  //naming your devices
/*#include 
#define BME_SCK 18
#define BME_MISO 19
#define BME_MOSI 23
#define BME_CS 5*/
#define SEALEVELPRESSURE_HPA (1013.25)
Adafruit_BME280 bme;  // I2C
//Adafruit_BME280 bme(BME_CS);  // hardware SPI
//Adafruit_BME280 bme(BME_CS, BME_MOSI, BME_MISO, BME_SCK);  // software SPI
void setup() {
  Serial.begin(115200);
    //Get IoTtweet Library version
  String libvers = myiot.getVersion();
  Serial.println(“IoTtweet Library vesion : “ + String(libvers));
  WiFi.begin(ssid, password);
  Serial.println(“Connecting");
  while(WiFi.status() != WL_CONNECTED) {
    delay(500);
    Serial.print(“.");
  }
  Serial.println(“");
  Serial.print(“Connected to WiFi network with IP Address: “);
  Serial.println(WiFi.localIP());
  // (you can also pass in a Wire library object like &Wire2)
  bool status = bme.begin(0x76);
  if (!status) {
    Serial.println(“Could not find a valid BME280 sensor, check wiring or change I2C address!");
    while (1);
  }
}
void loop() {
  //Check WiFi connection status
  if(WiFi.status()== WL_CONNECTED){
    HTTPClient http;
    // Your Domain name with URL path or IP address with path
    http.begin(serverName);
    // Specify content-type header
    http.addHeader(“Content-Type"“application/x-www-form-urlencoded");
    // Prepare your HTTP POST request data
    String httpRequestData = “api_key=" + apiKeyValue + “&sensor=" + sensorName
                          + “&location=" + sensorLocation + “&value1=" + String(bme.readTemperature())
                          + “&value2=" + String(bme.readHumidity()) + “&value3=" + String(bme.readPressure()/100.0F) + “";
    Serial.print(“httpRequestData: “);
    Serial.println(httpRequestData);
    // You can comment the httpRequestData variable above
    // then, use the httpRequestData variable below (for testing purposes without the BME280 sensor)
    //String httpRequestData = “api_key=tPmAT5Ab3j7F9&sensor=BME280&location=Office&value1=24.75&value2=49.54&value3=1005.14";
    // Send HTTP POST request
    int httpResponseCode = http.POST(httpRequestData);
    // If you need an HTTP request with a content type: text/plain
    //http.addHeader(“Content-Type", “text/plain");
    //int httpResponseCode = http.POST(“Hello, World!");
    // If you need an HTTP request with a content type: application/json, use the following:
    //http.addHeader(“Content-Type", “application/json");
    //int httpResponseCode = http.POST(“{“value1":"19","value2":"67","value3":"78"}");
    if (httpResponseCode>0) {
      Serial.print(“HTTP Response code: “);
      Serial.println(httpResponseCode);
    }
    else {
      Serial.print(“Error code: “);
      Serial.println(httpResponseCode);
    }
    // Free resources
    http.end();
    //Example data generating
  data0 = bme.readTemperature();
  data1 = bme.readHumidity();
  data2 = random(40,60);
  data3 = random(50,55);
  //Send data from your iot to Dashboard
  String response = myiot.WriteDashboard(userid,key,data0,data1,data2,data3,private_tweet,public_tweet);
  Serial.println(response);   //Show response JSON from www.iottweet.com
  }
  else {
    Serial.println(“WiFi Disconnected");
  }
  //Send an HTTP POST request every 30 seconds
  delay(30000);
}

ตั้งค่าข้อมูล network wifi ของเรา

// Replace with your network credentials
const char* ssid     = "REPLACE_WITH_YOUR_SSID";
const char* password = "REPLACE_WITH_YOUR_PASSWORD";

Setting your serverName

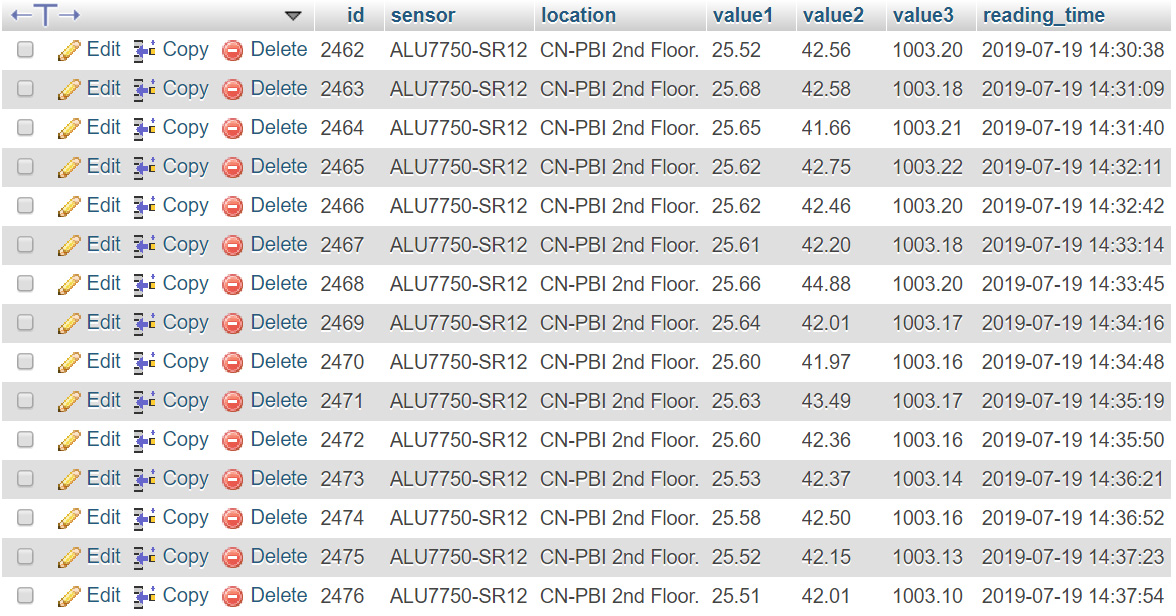
const char* serverName = "http://example-domain.com/post-esp-data.php";

เมื่อเสร็จแล้วลองทดสอบดูนะครับ จะต้องขึ้นตามนี้

ตรวจสอบที่ phpMyAdmin จะต้องเห็นข้อมูลใน Server

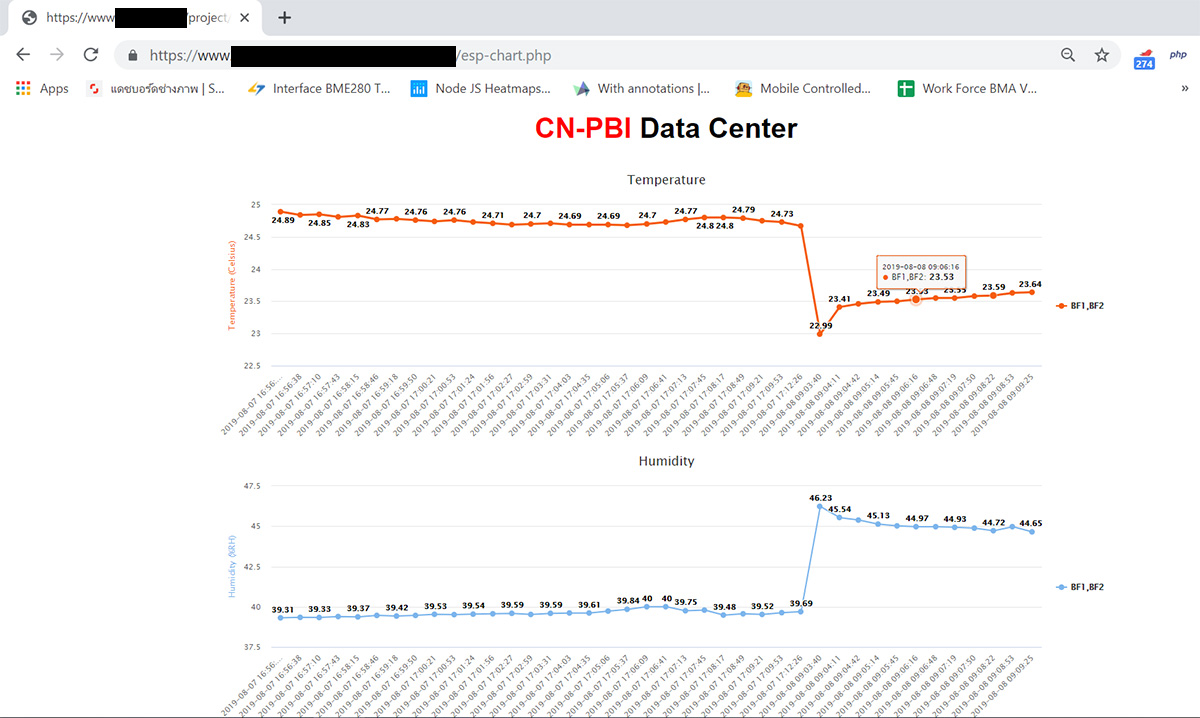
ถ้าจะให้แสดงในลักษณะกราฟก็นำข้อมูลมา plot ได้ โดยสร้างไฟล์ใหม่ชื่อ esp-chart.php ตามโค๊ดด้านล่าง

$servername = “localhost";
// REPLACE with your Database name
$dbname = “REPLACE_WITH_YOUR_DATABASE_NAME";
// REPLACE with Database user
$username = “REPLACE_WITH_YOUR_USERNAME";
// REPLACE with Database user password
$password = “REPLACE_WITH_YOUR_PASSWORD";
// Create connection
$conn = new mysqli($servername$username$password$dbname);
// Check connection
if ($conn->connect_error) {
    die(“Connection failed: “ . $conn->connect_error);
}
$sql = SELECT id, value1, value2, value3, reading_time FROM Sensor order by reading_time desc limit 40;
$result = $conn->query($sql);
while ($data = $result->fetch_assoc()){
    $sensor_data[] = $data;
}
$readings_time = array_column($sensor_data‘reading_time’);
$value1 = json_encode(array_reverse(array_column($sensor_data‘value1’)), JSON_NUMERIC_CHECK);
$value2 = json_encode(array_reverse(array_column($sensor_data‘value2’)), JSON_NUMERIC_CHECK);
$value3 = json_encode(array_reverse(array_column($sensor_data‘value3’)), JSON_NUMERIC_CHECK);
$reading_time = json_encode(array_reverse($readings_time), JSON_NUMERIC_CHECK);
$result->free();
$conn->close();
?>
DOCTYPE html>
<html>
<meta name=“viewport" content=“width=device-width, initial-scale=1">
  <script src=“https://code.highcharts.com/highcharts.js">script>
  <style>
    body {
      min-width310px;
        max-width1280px;
        height500px;
      margin0 auto;
    }
    h2 {
      font-familyArial;
      font-size2.5rem;
      text-aligncenter;
    }
  style>
  <body>
    <h2>ESP Weather Stationh2>
    <div id=“chart-temperature" class=“container">div>
    <div id=“chart-humidity" class=“container">div>
    <div id=“chart-pressure" class=“container">div>
<script>
var value1 =  echo $value1?>;
var value2 =  echo $value2?>;
var value3 =  echo $value3?>;
var reading_time =  echo $reading_time?>;
var chartT = new Highcharts.Chart({
  chart:renderTo : ‘chart-temperature’ },
  title: { text: ‘BME280 Temperature’ },
  series: [{
    showInLegend: false,
    data: value1
  }],
  plotOptions: {
    line: { animation: false,
      dataLabels: { enabled: true }
    },
    series: { color: ‘#059e8a’ }
  },
  xAxis: {
    type: ‘datetime’,
    categories: reading_time
  },
  yAxis: {
    title: { text: ‘Temperature (Celsius)’ }
    //title: { text: ‘Temperature (Fahrenheit)’ }
  },
  credits: { enabled: false }
});
var chartH = new Highcharts.Chart({
  chart:renderTo:‘chart-humidity’ },
  title: { text: ‘BME280 Humidity’ },
  series: [{
    showInLegend: false,
    data: value2
  }],
  plotOptions: {
    line: { animation: false,
      dataLabels: { enabled: true }
    }
  },
  xAxis: {
    type: ‘datetime’,
    //dateTimeLabelFormats: { second: ‘%H:%M:%S’ },
    categories: reading_time
  },
  yAxis: {
    title: { text: ‘Humidity (%)’ }
  },
  credits: { enabled: false }
});
var chartP = new Highcharts.Chart({
  chart:renderTo:‘chart-pressure’ },
  title: { text: ‘BME280 Pressure’ },
  series: [{
    showInLegend: false,
    data: value3
  }],
  plotOptions: {
    line: { animation: false,
      dataLabels: { enabled: true }
    },
    series: { color: ‘#18009c’ }
  },
  xAxis: {
    type: ‘datetime’,
    categories: reading_time
  },
  yAxis: {
    title: { text: ‘Pressure (hPa)’ }
  },
  credits: { enabled: false }
});
script>
body>
html>